Aurora
Data Visualization | Processing
Oscilla
Interactive Installation | Allolib + Pd
Luminaria
LED Installation | Arduino
GeoD
Data Visualization | Google Maps JS API
Invisible Machine
Exhibition | Web Design/Curation
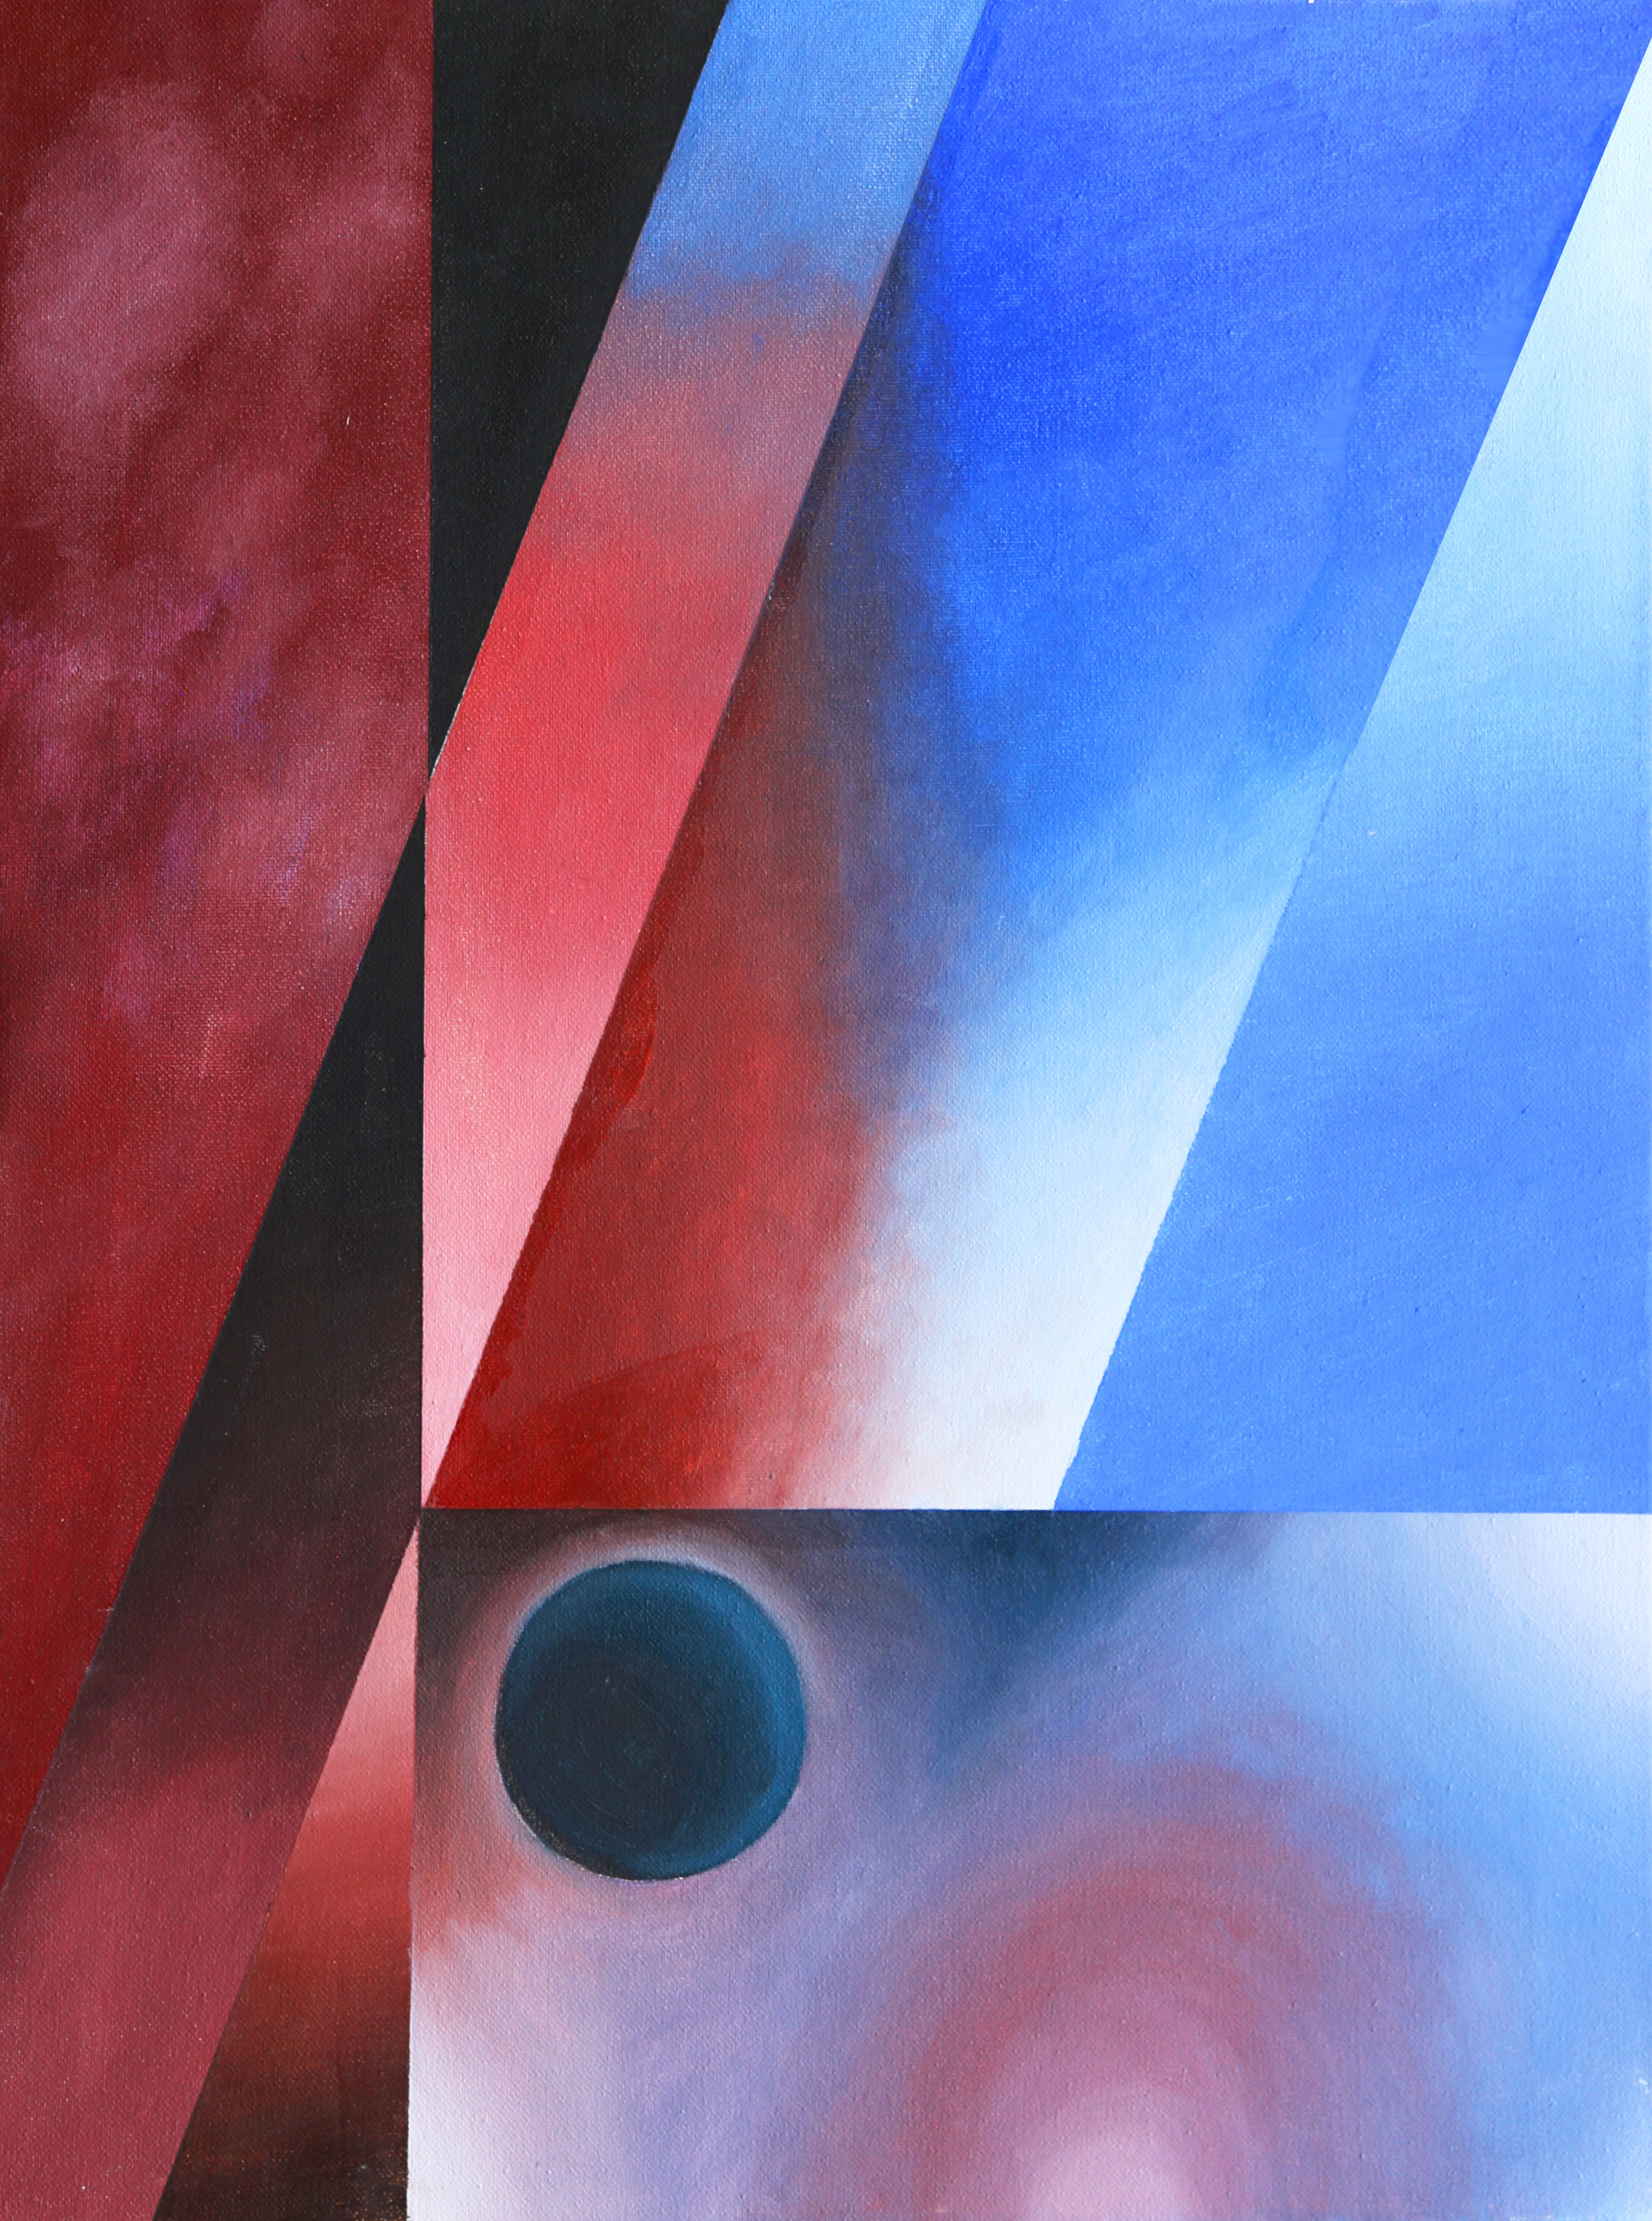
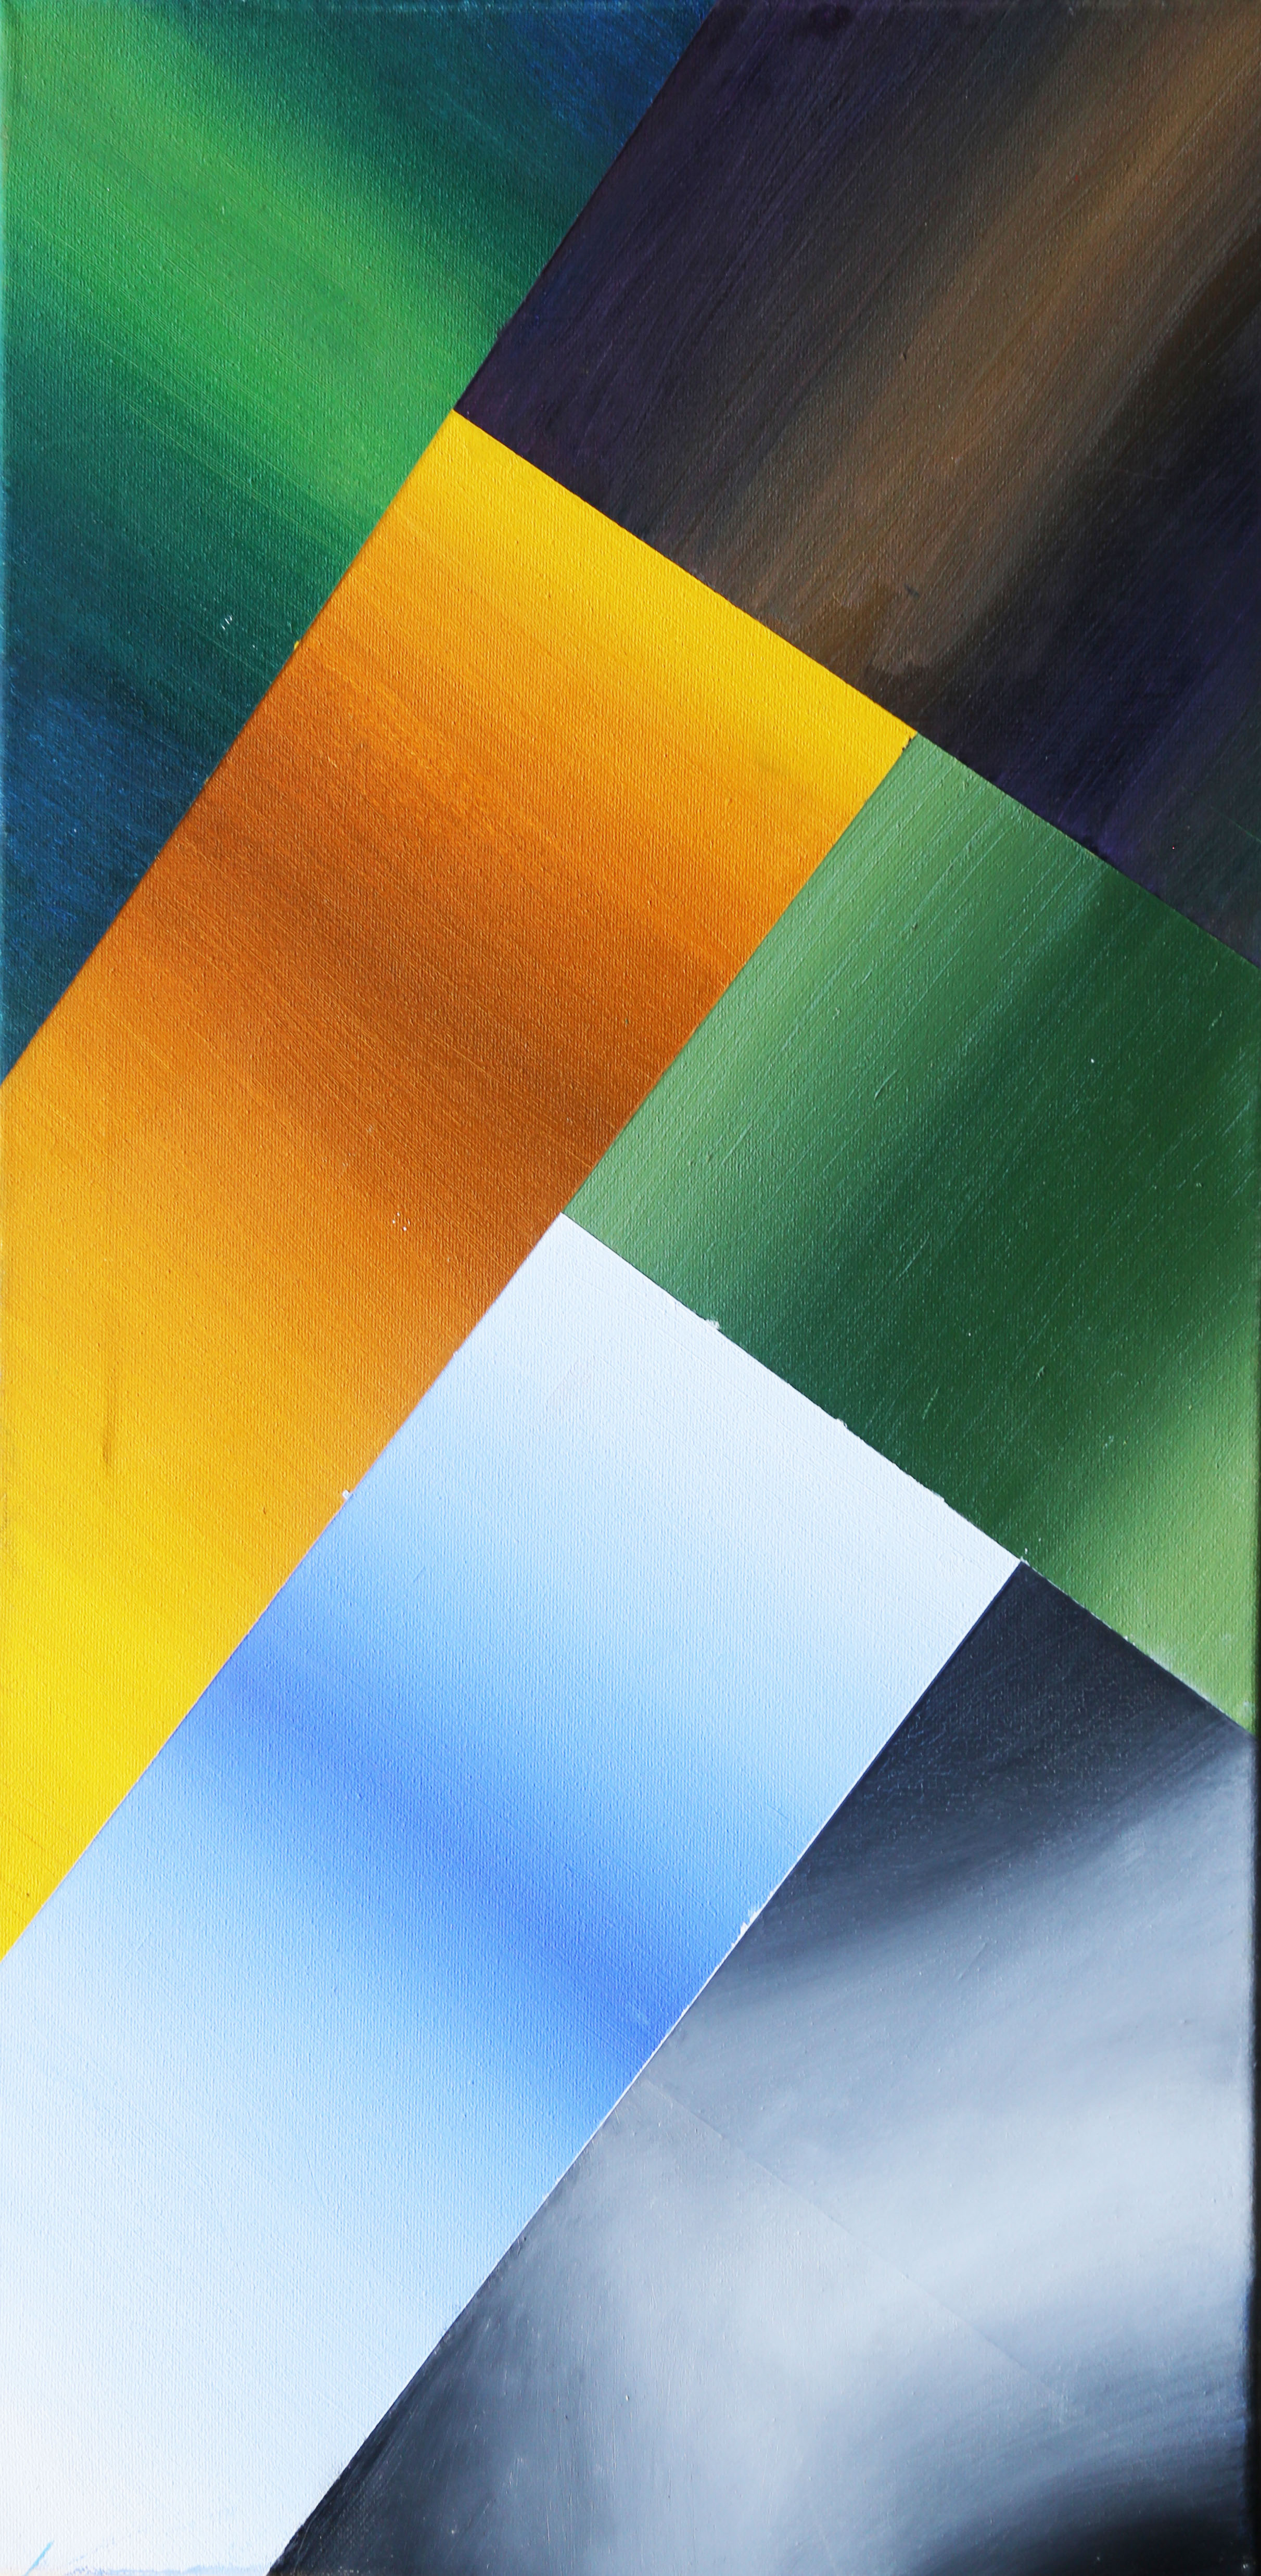
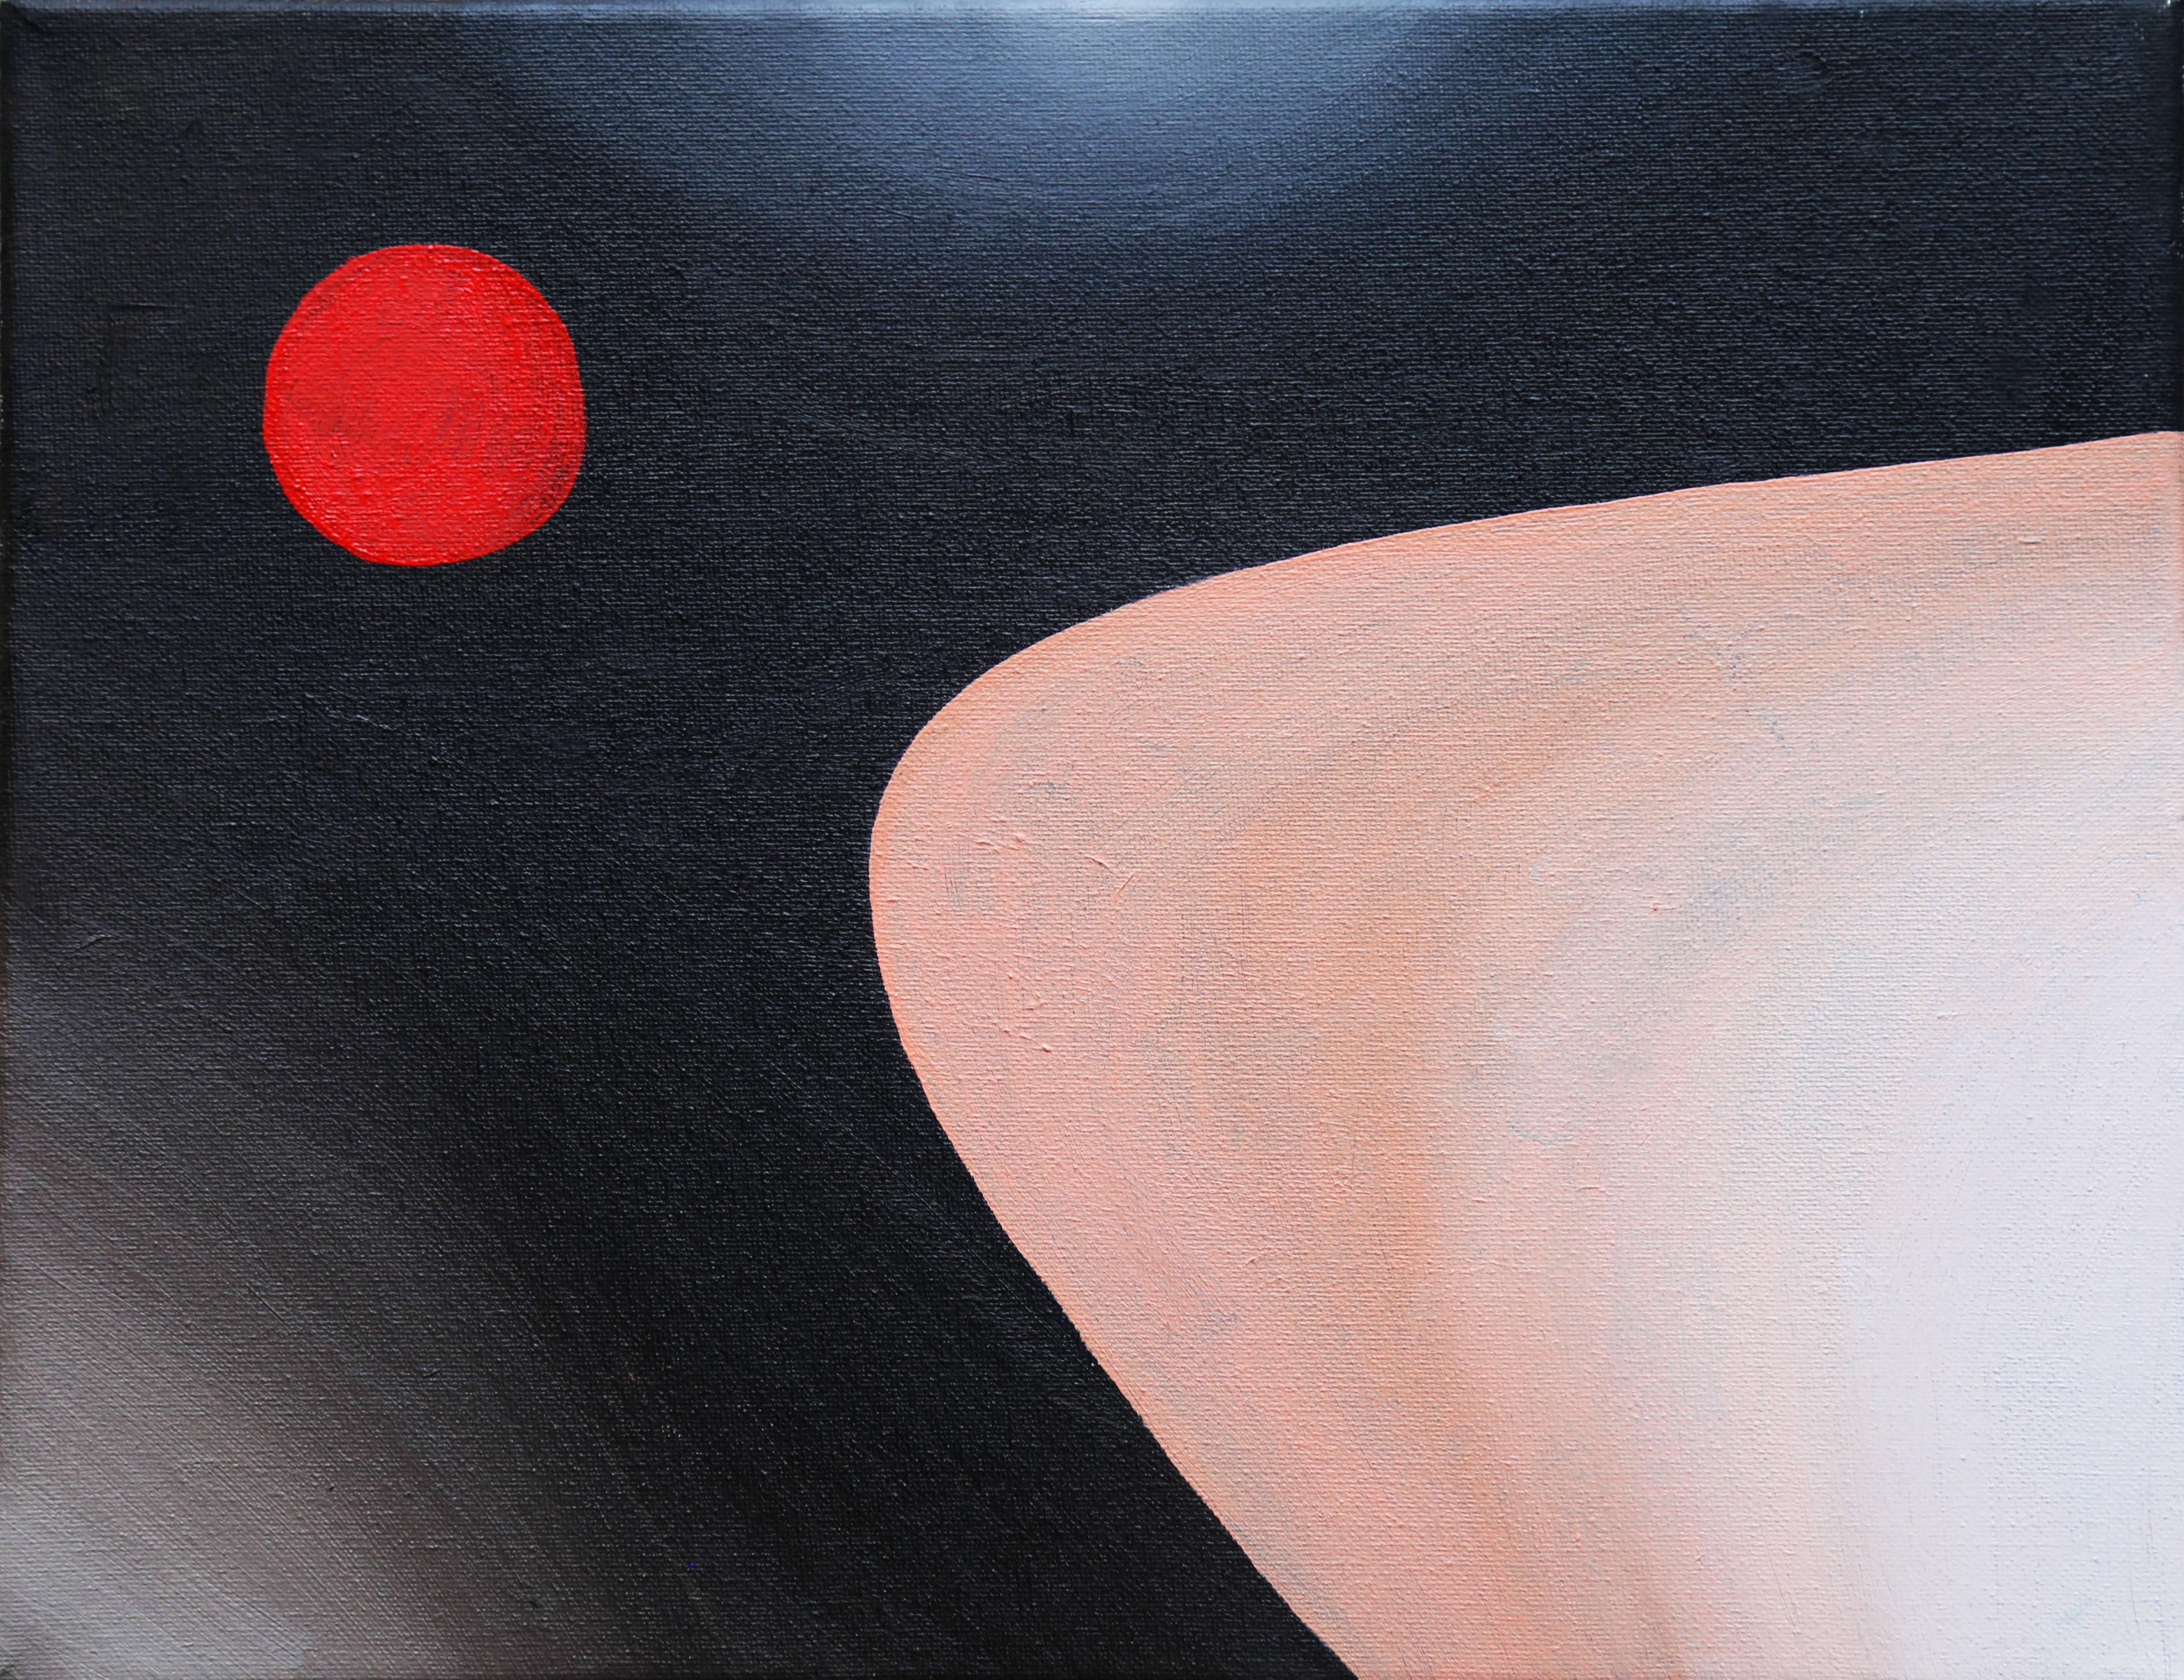
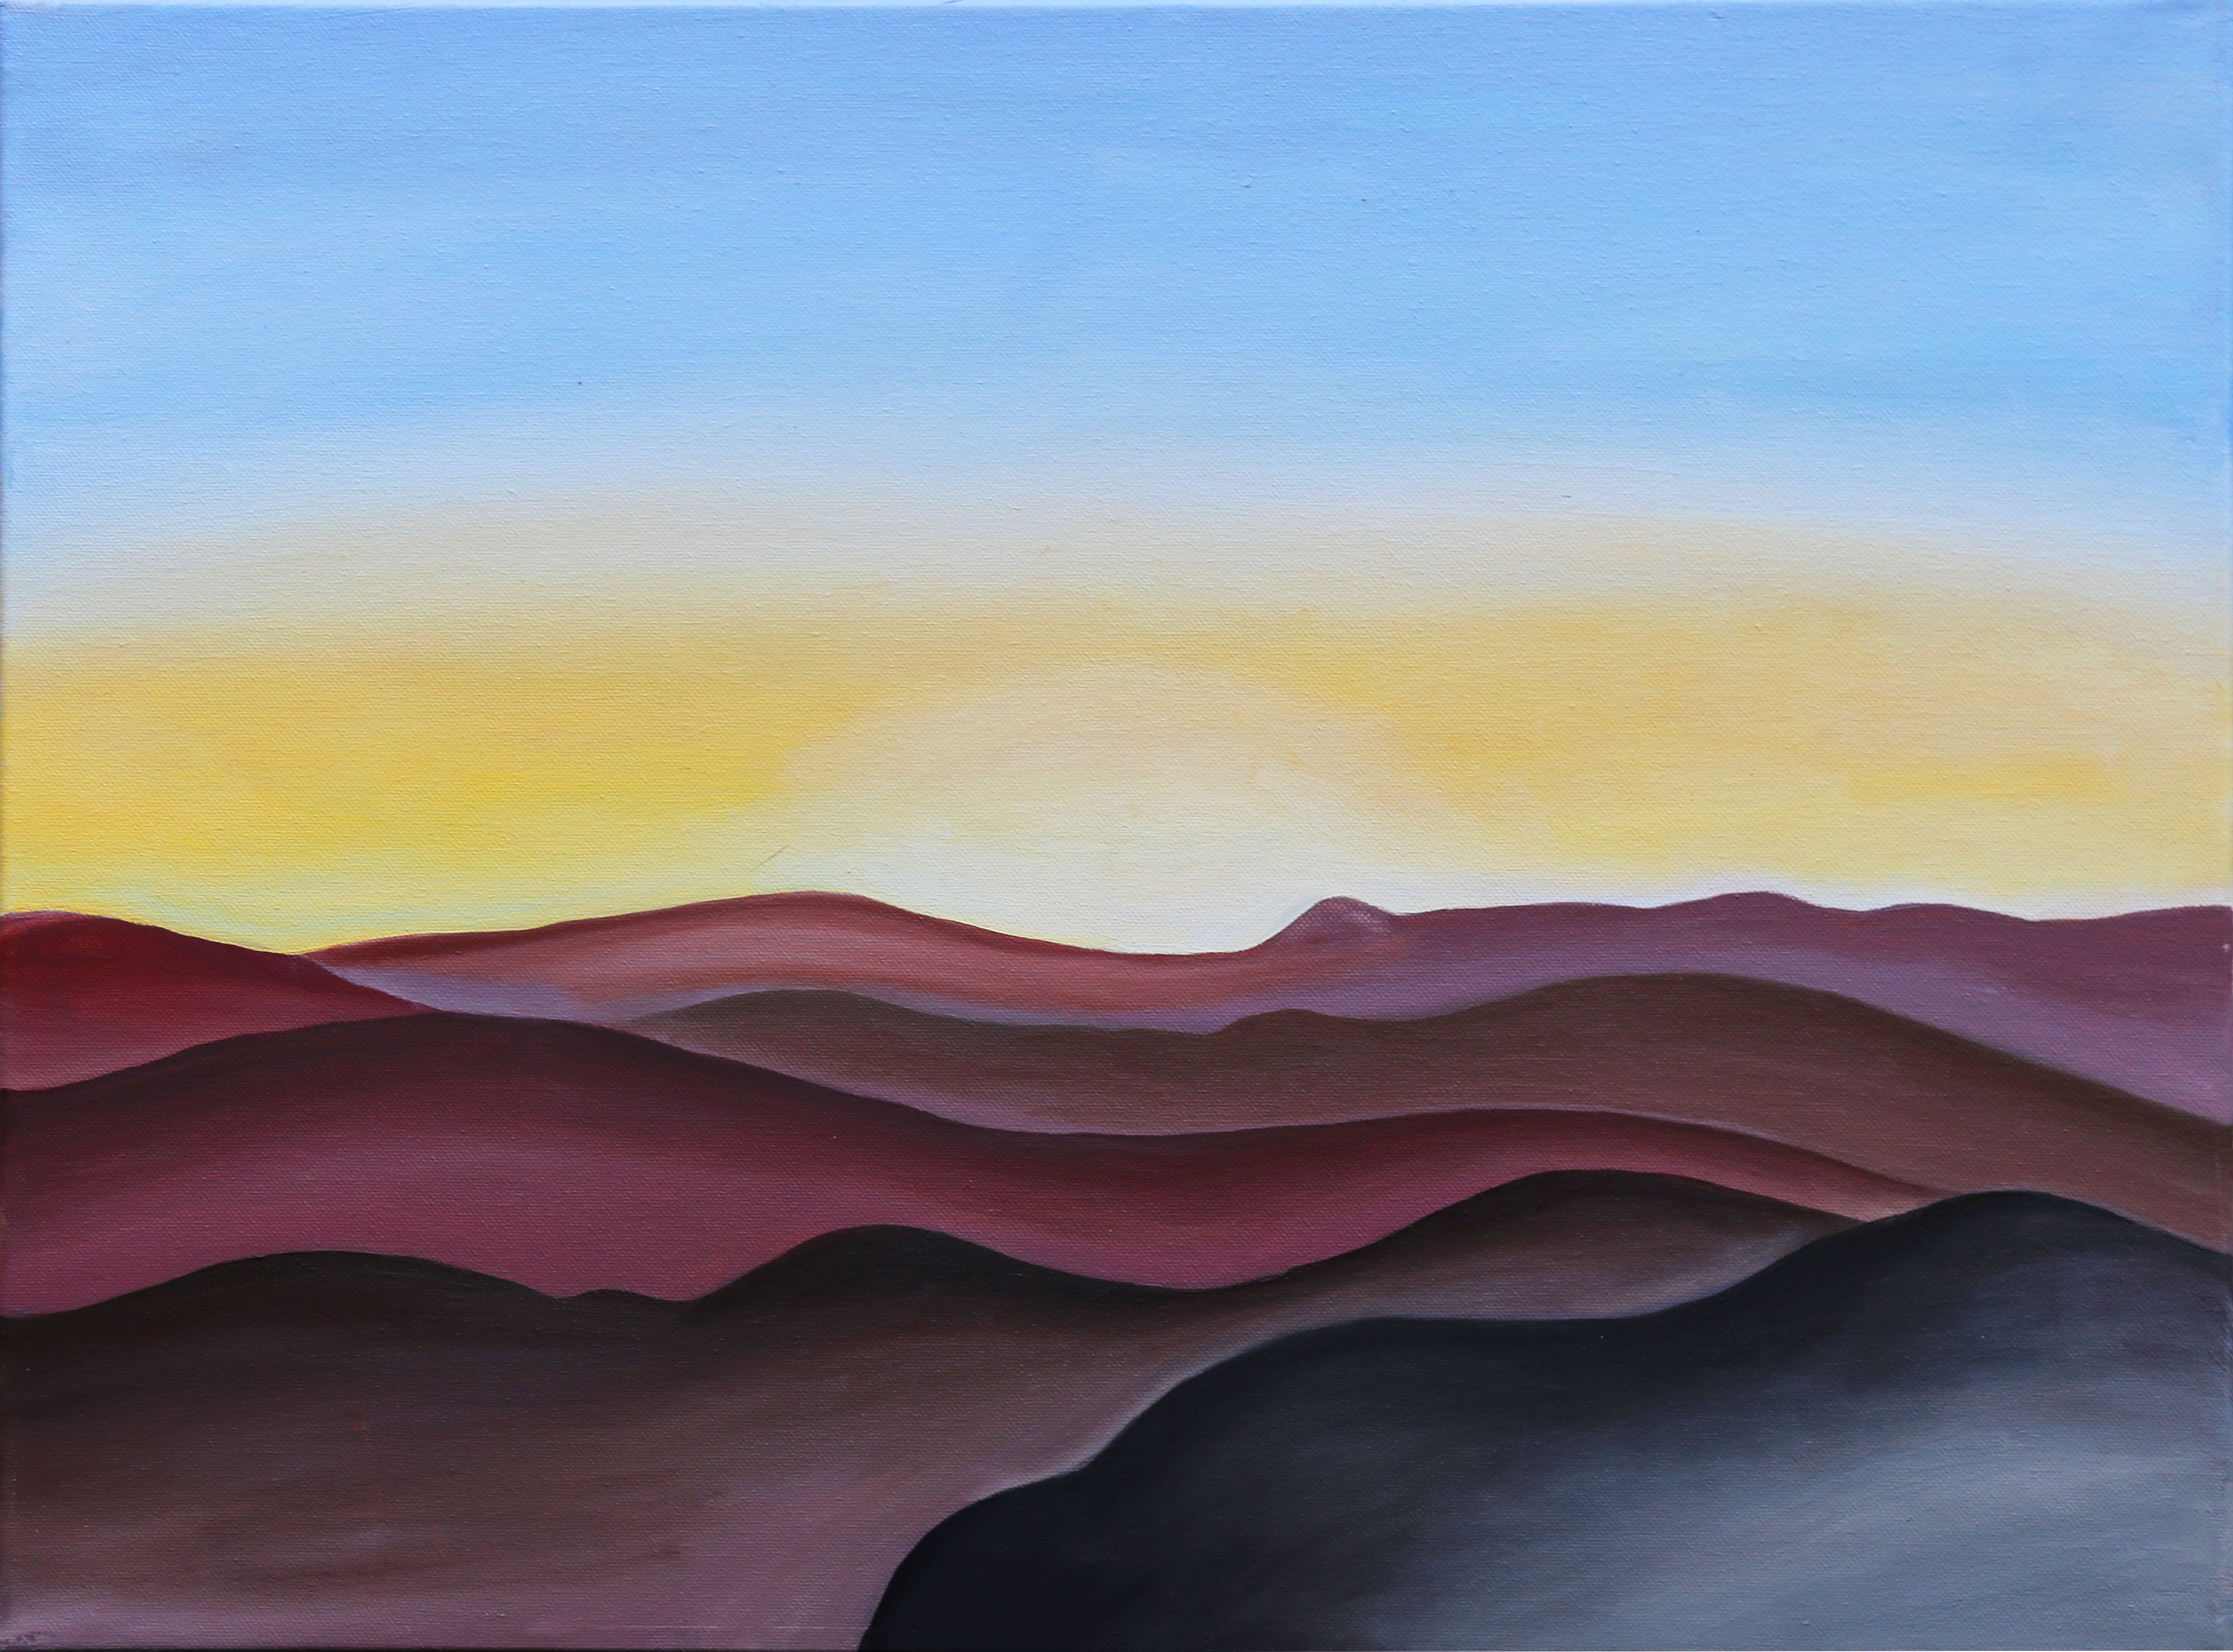
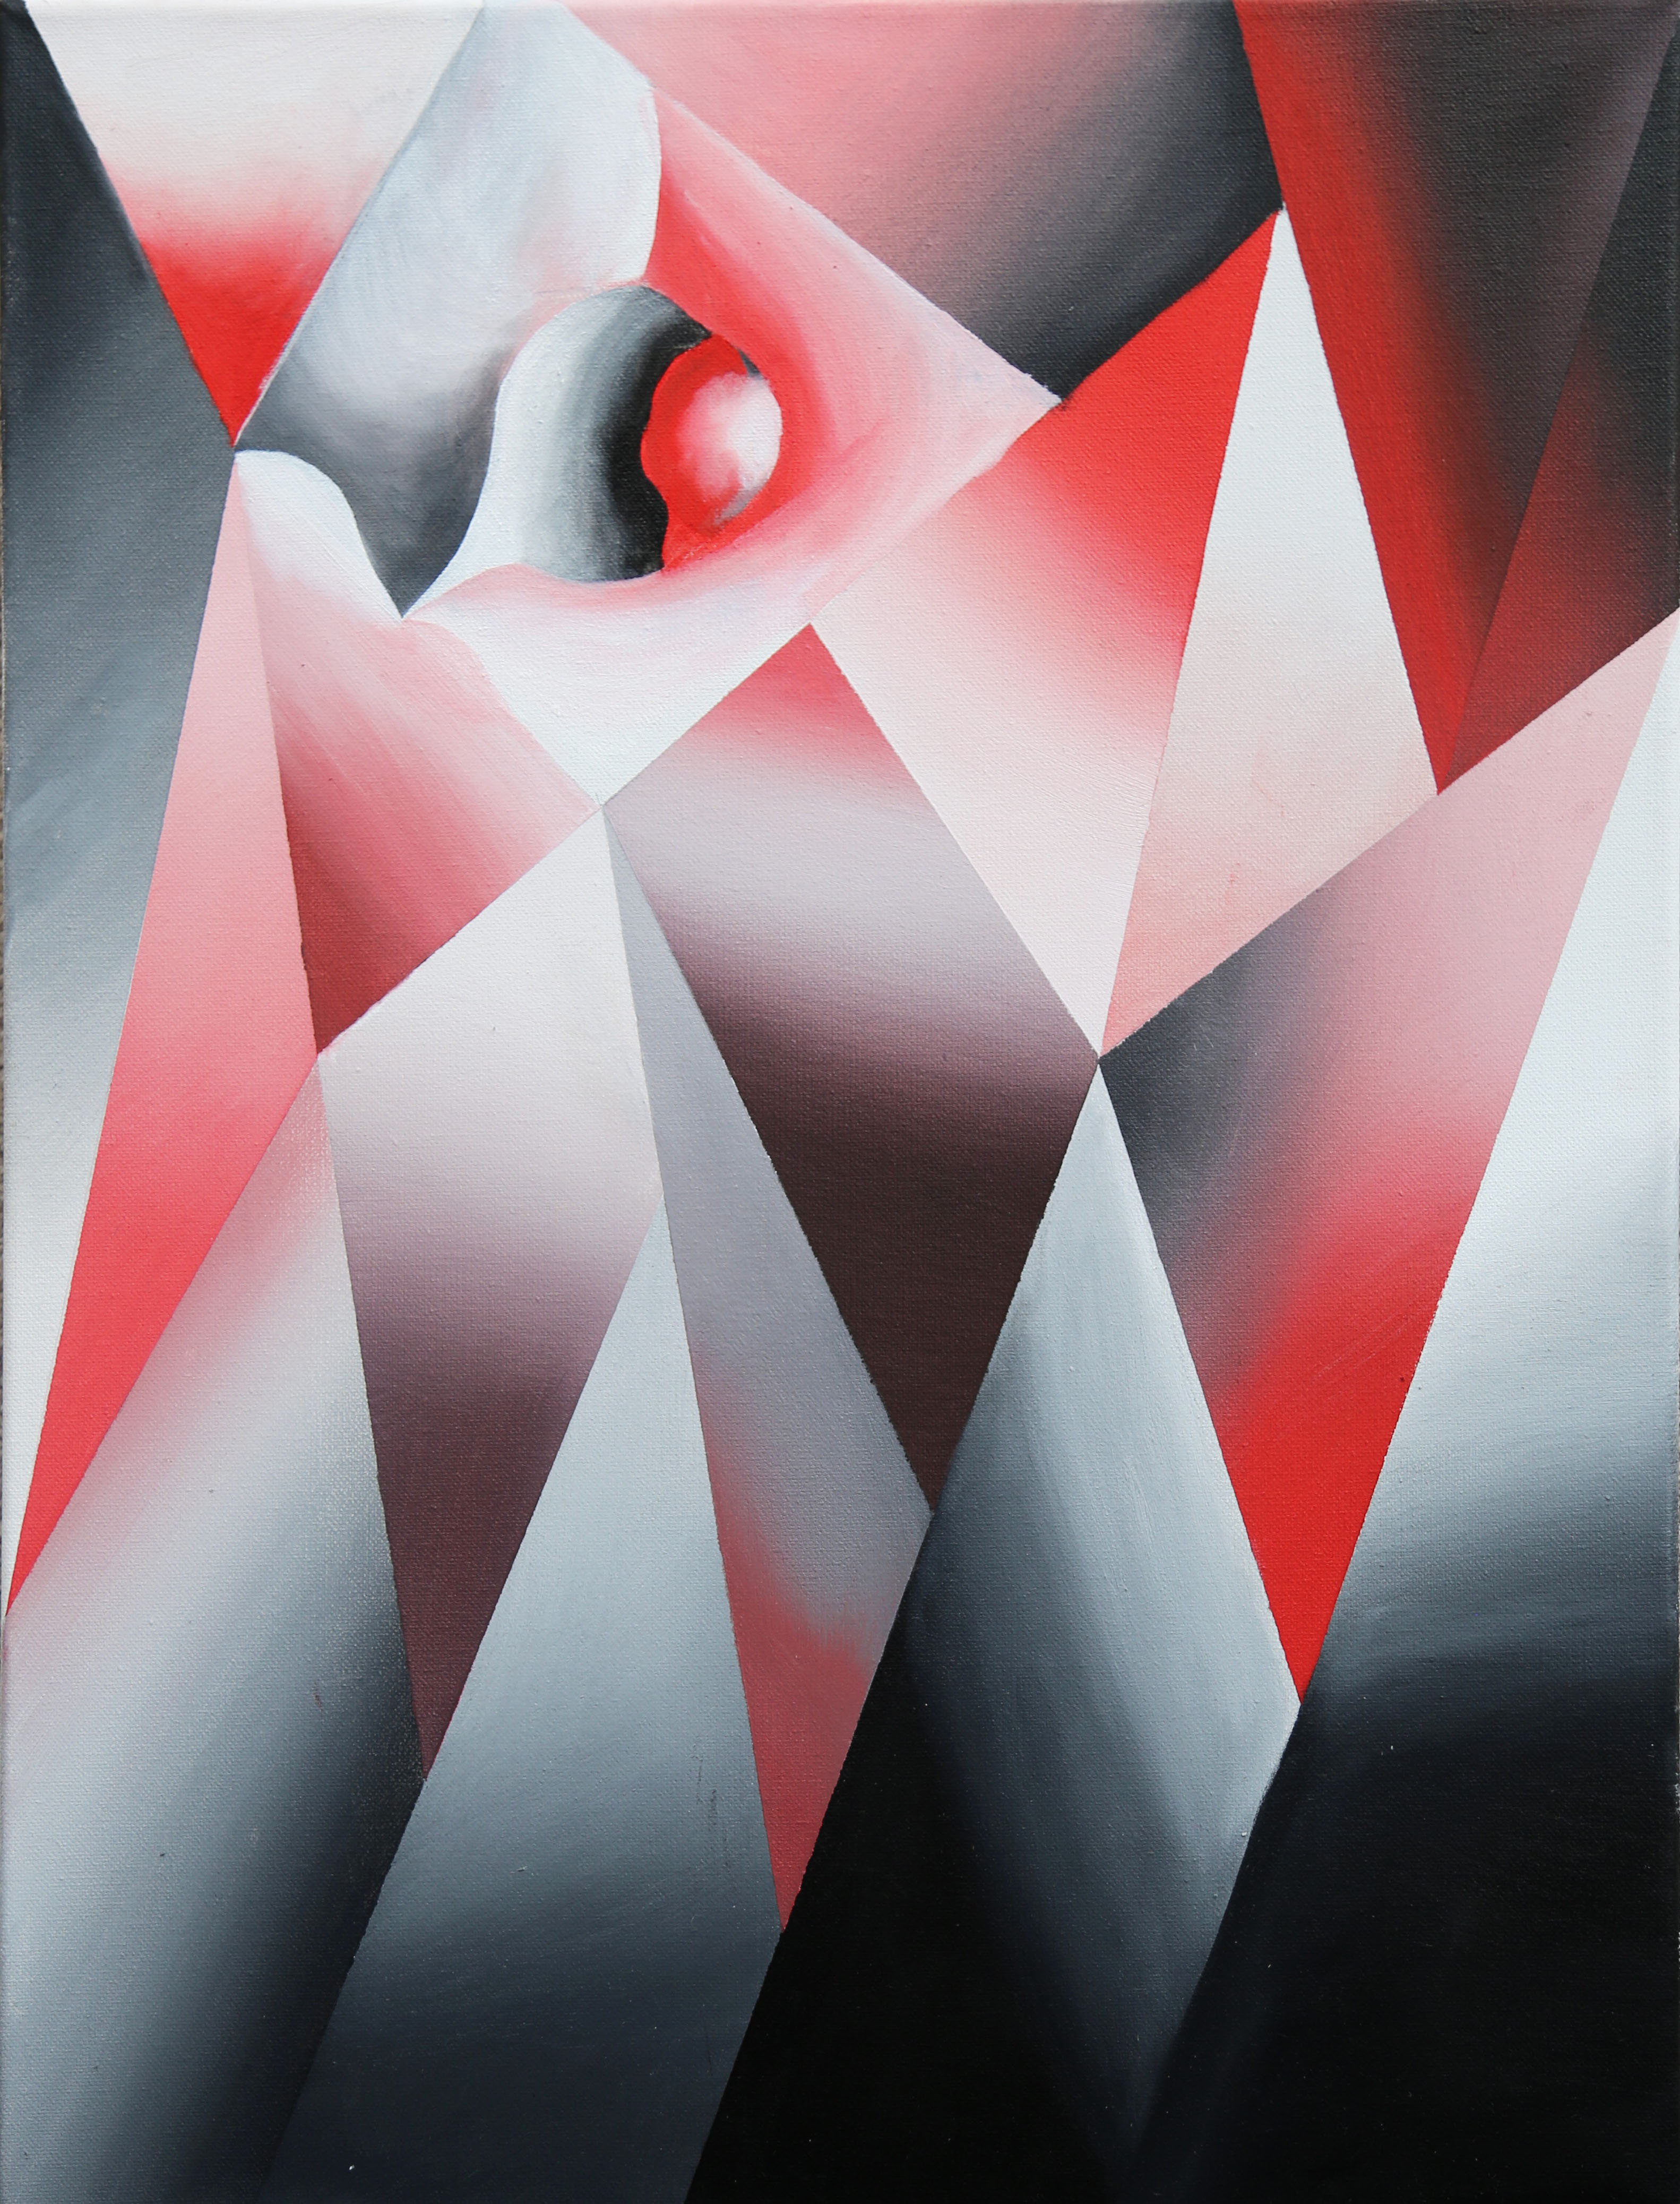
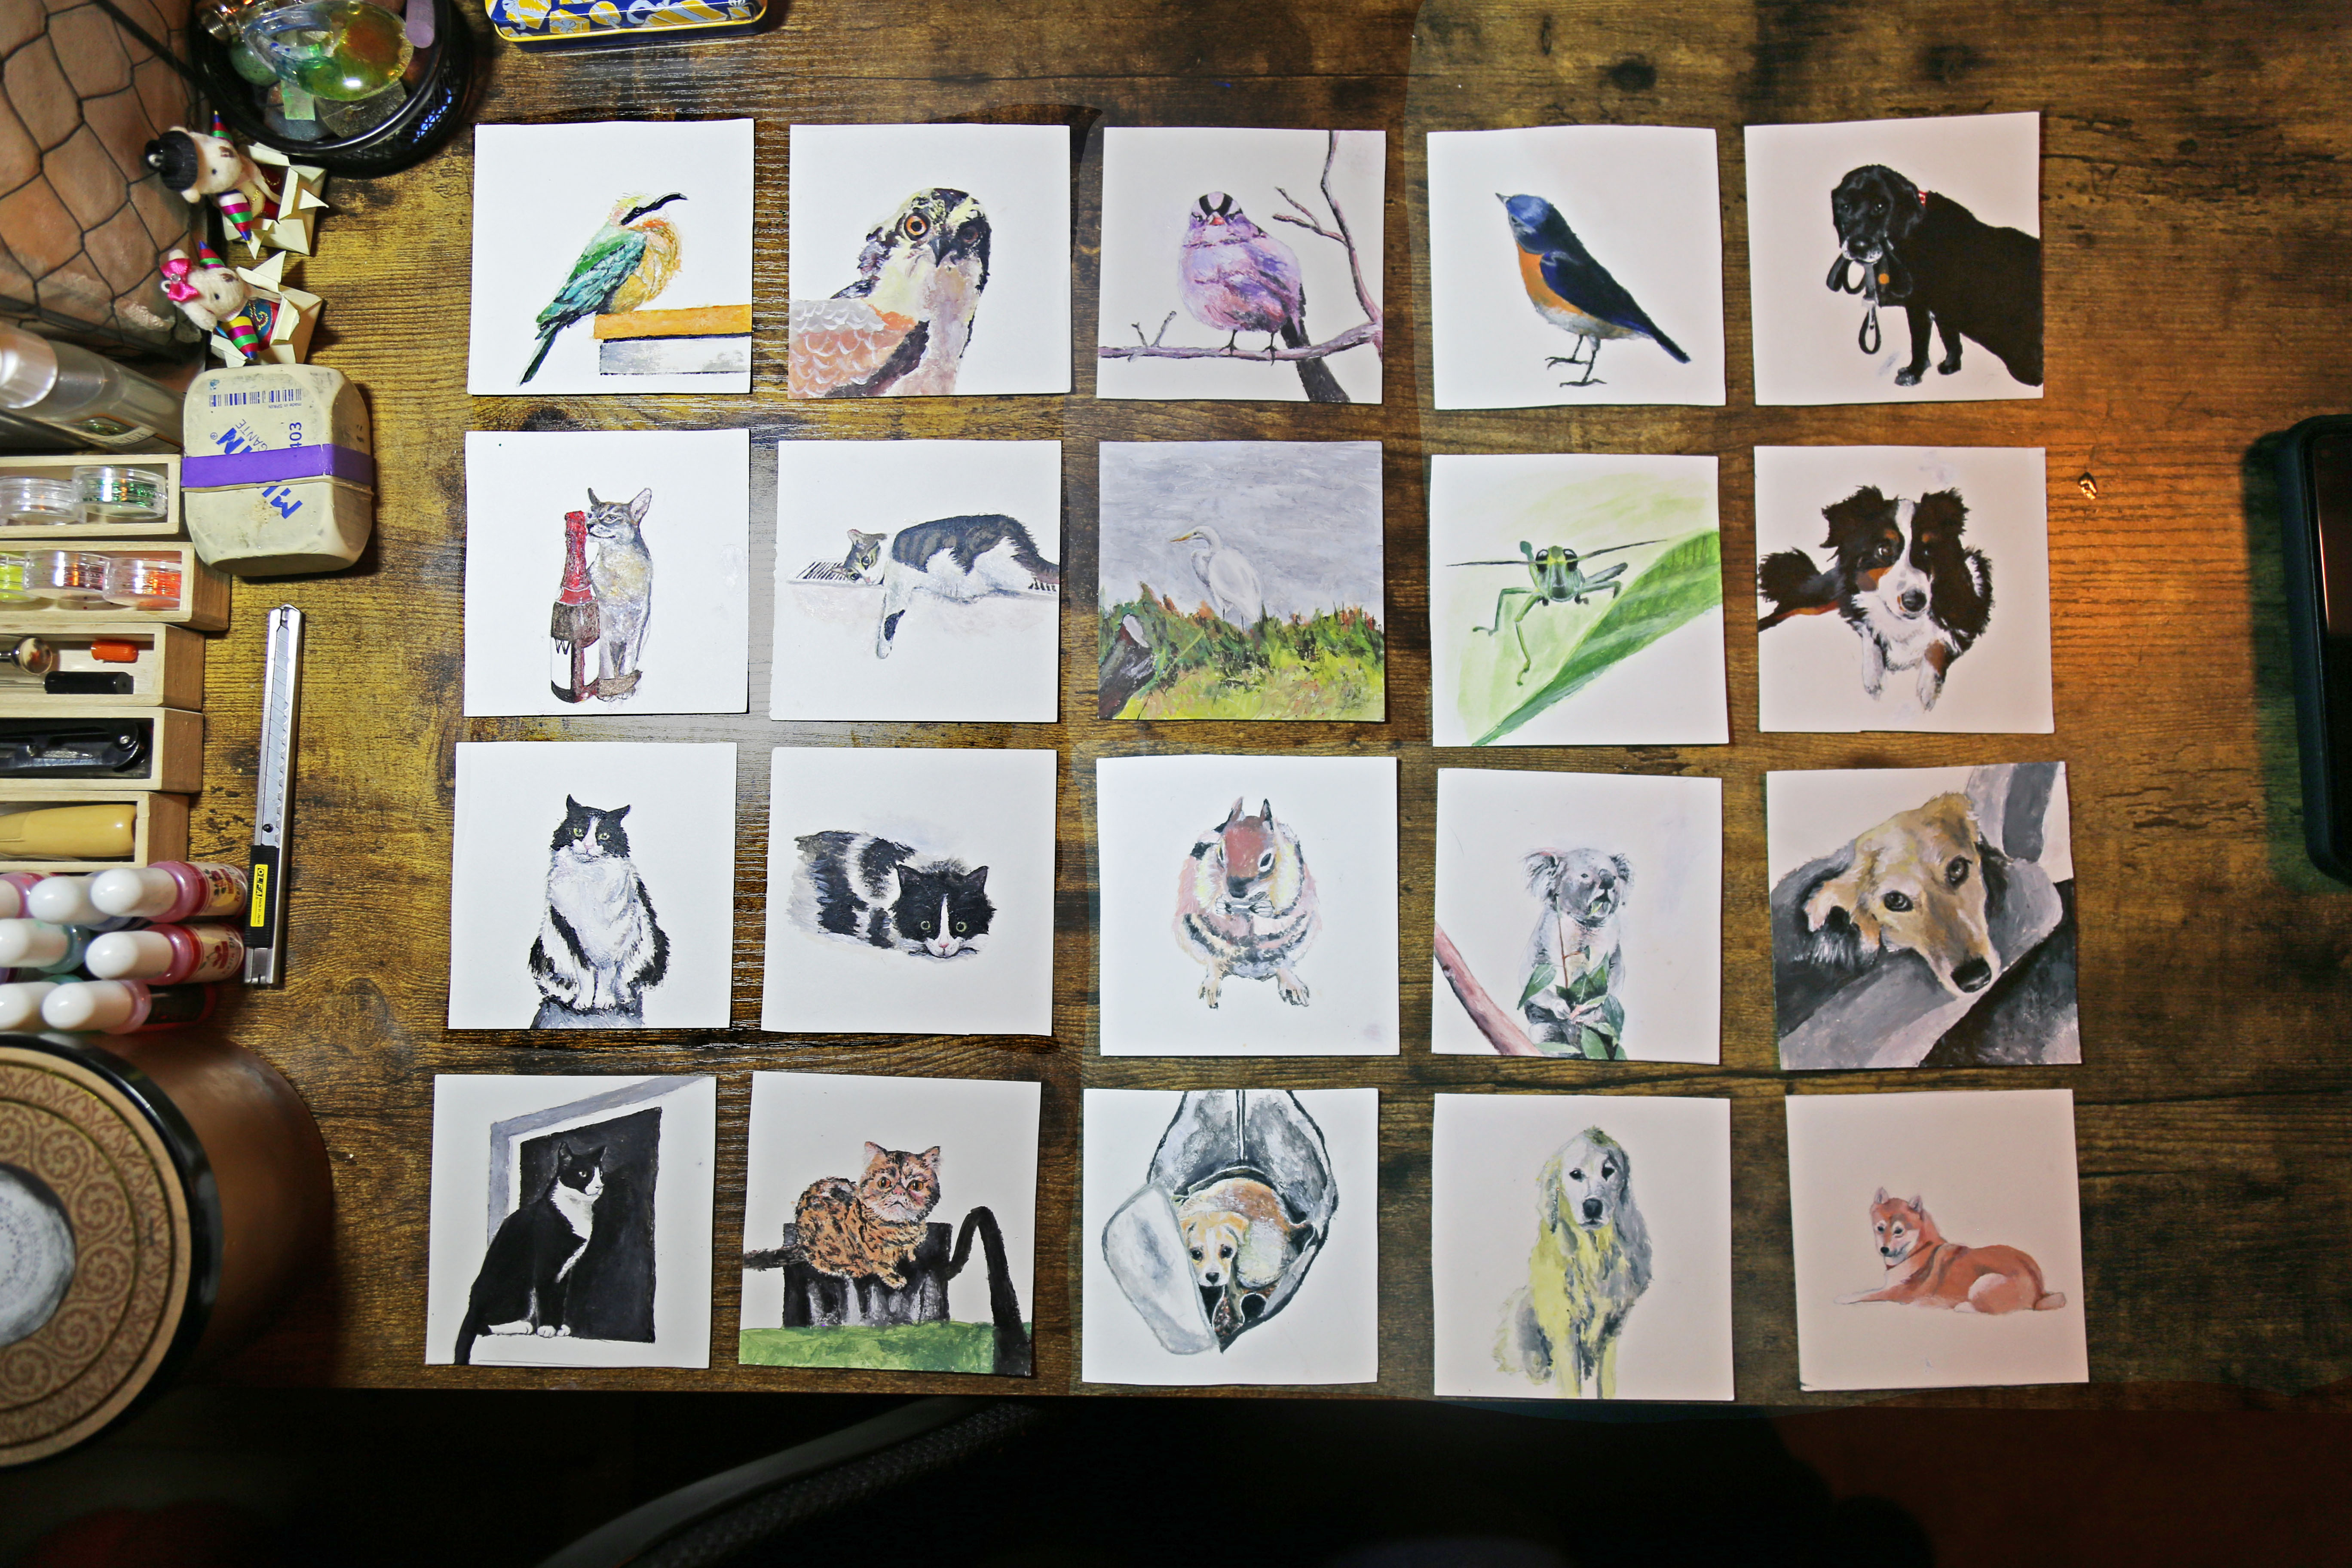
Painting Series
Paintings | Oil on canvas
Press
Oscilla was mentioned in Noozhawk article: New Santa Barbara Museum Takes Visitor Interaction to a Higher Plane
Oscilla was mentioned in SB Independent article: MUSEUM OF SENSORY AND MOVEMENT EXPERIENCES
Oscilla was featured in Edhat article: MUSEUM OF SENSORY AND MOVEMENT EXPERIENCES
Xindi Kang and Rodney DuPlessis were included in the article The Modern Renaissance Man, an interview by the UC Santa Barbara Alumni Spotlight
Events
2023 Sep --- Xindi Kang joins the Computational Media and Arts program at the Hong Kong Univeristy of Science and Technology.
2023 May --- Xindi Kang is holding an arts and craft workshop with Nugget Records, Beijing.
2022 Sep --- Xindi Kang is scheduled to hold a virtual workshop based on Oscilla at XVirtual.
2021 Oct --- Oscilla is scheduled for a 4-month exhibit at the Interactive Media Theater at The Wolf Museum of Exploration and Innovation (MOXI), Santa Barbara, CA, USA
2021 Sep --- Xindi Kang obtains Master of Science degree from Media Arts and Technology at University of California, Santa Barbara
2021 Jun --- Xindi Kang presents her Master’s Thesis Translating Between Art and Technology Through Interactive Visualizations at University of California, Santa Barbara
2020 Sep --- Xindi Kang and Sihwa Park Present GeoD at WE1S Summer Research Camp
2020 Aug --- Oscilla becomes a long-term artwork exhibiting at The Museum of Sensory and Movement Experiences (MSME) in Santa Barbara, CA, USA
2020 Jan --- Xindi Kang presents Oscilla at AWMAS conference in Santa Barbara, CA, USA
2019 Aug --- Xindi Kang attends Digital Naturalism Conference (DINACON) along with artists David Bowen and Madeline Schwartzman in Gamboa, Panama,
2019 May --- Xindi Kang accepts invitation for a six-month research fellowship at the Media Informatics Group at LMU Munich, Germany, directed by Prof. Dr. Andreas Butz
2019 Jun --- Oscilla Exhibits at EoYS M.A.D.E
2019 Feb --- Oscilla Exhibits at Santa Barbara Center for Art, Science and Technology (SBCAST), Santa Barbara, CA, USA
2019 Jan --- Xindi Kang attends Vector Hack Workshop by Derek Holzer
2018 Dec --- Xindi Kang joins as data visualization specialist at the Interpretation Lab at WE1S research group directed by Prof. Alan Liu and Prof. Dan Costa Baciu
2018 Jun --- EoYS Invisible Machine Exhibition Opens to public at University of California, Santa Barbara
2017 Jun --- Aurora Exhibits at EOYS Rehabituation
2016 May --- Luminaria is installed on Anisquoyo Park Bridge and exhibits at Isla Vista Lightworks Festival
2015 Dec --- Xindi Kang Joins as Research Assistant at Experimental Visualization Lab directed by Prof. George Legrady
2015 May --- Xindi Kang Joins UC Santa Barbara MFA studio as Artist Assistant for Jennifer Lugris
Teaching
cindykang95[at]gmail[dot]com
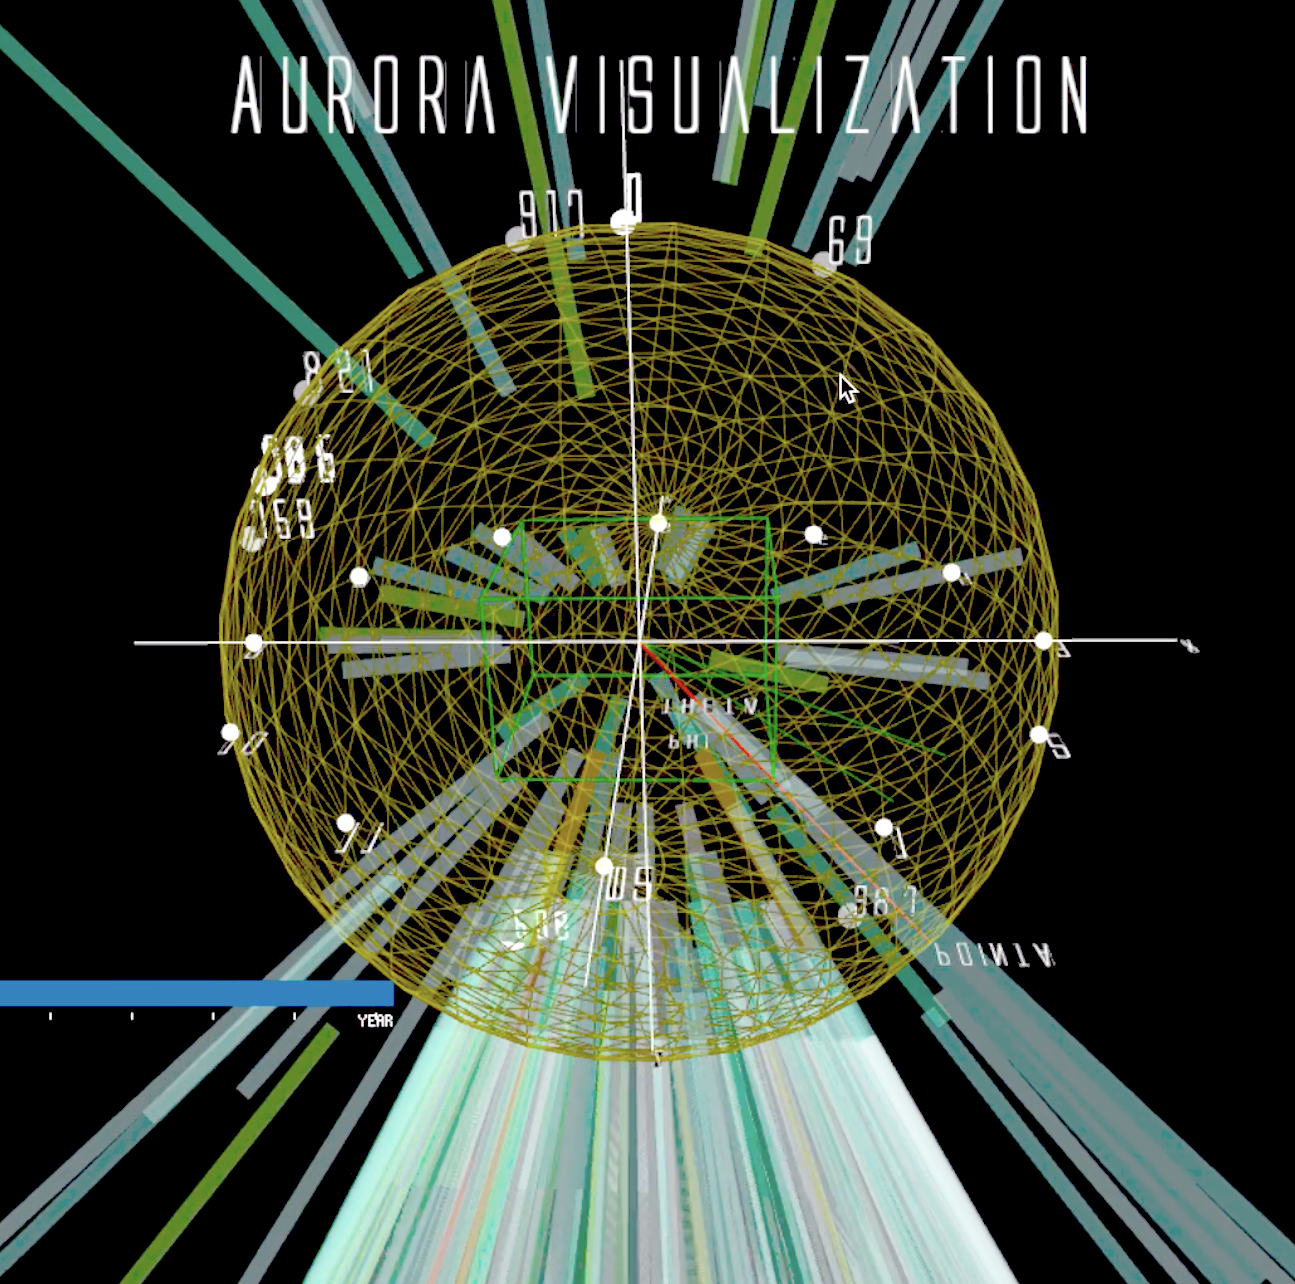
Aurora
Aurora is a three-dimensional data visualization and an immersive artwork (when viewed in virtual reality) that invites viewers to explore the dynamic relationship between human curiosity and the aurora borealis, a natural light display in the North Pole. Using a combination of book-checkout data from the Seattle Public Library and solar wind intensity data from NASA spanning from 2006-2014, Aurora visualizes four dimensions of information (month, year, book type, and level of interest/intensity) on a spherical coordinate system, allowing viewers to engage with the visualization from multiple perspectives. The raw data sets are transformed through SQL and Python and mapped to semi-transparent beams hovering over a sphere, creating wavering visuals resembling the northern light. By using the graphical user interface element, viewers can scroll through each year in the 10-year data set, observing the mesmerizing fluctuation between years, and even activating or deactivating various scales, such as month, year, and book type (dewey class). This innovative approach to data visualization invites viewers to explore the intersection of science and art, inspiring a new way of thinking about complex, multi-dimensional data sets, and providing a fresh perspective on the wonder of the aurora borealis.
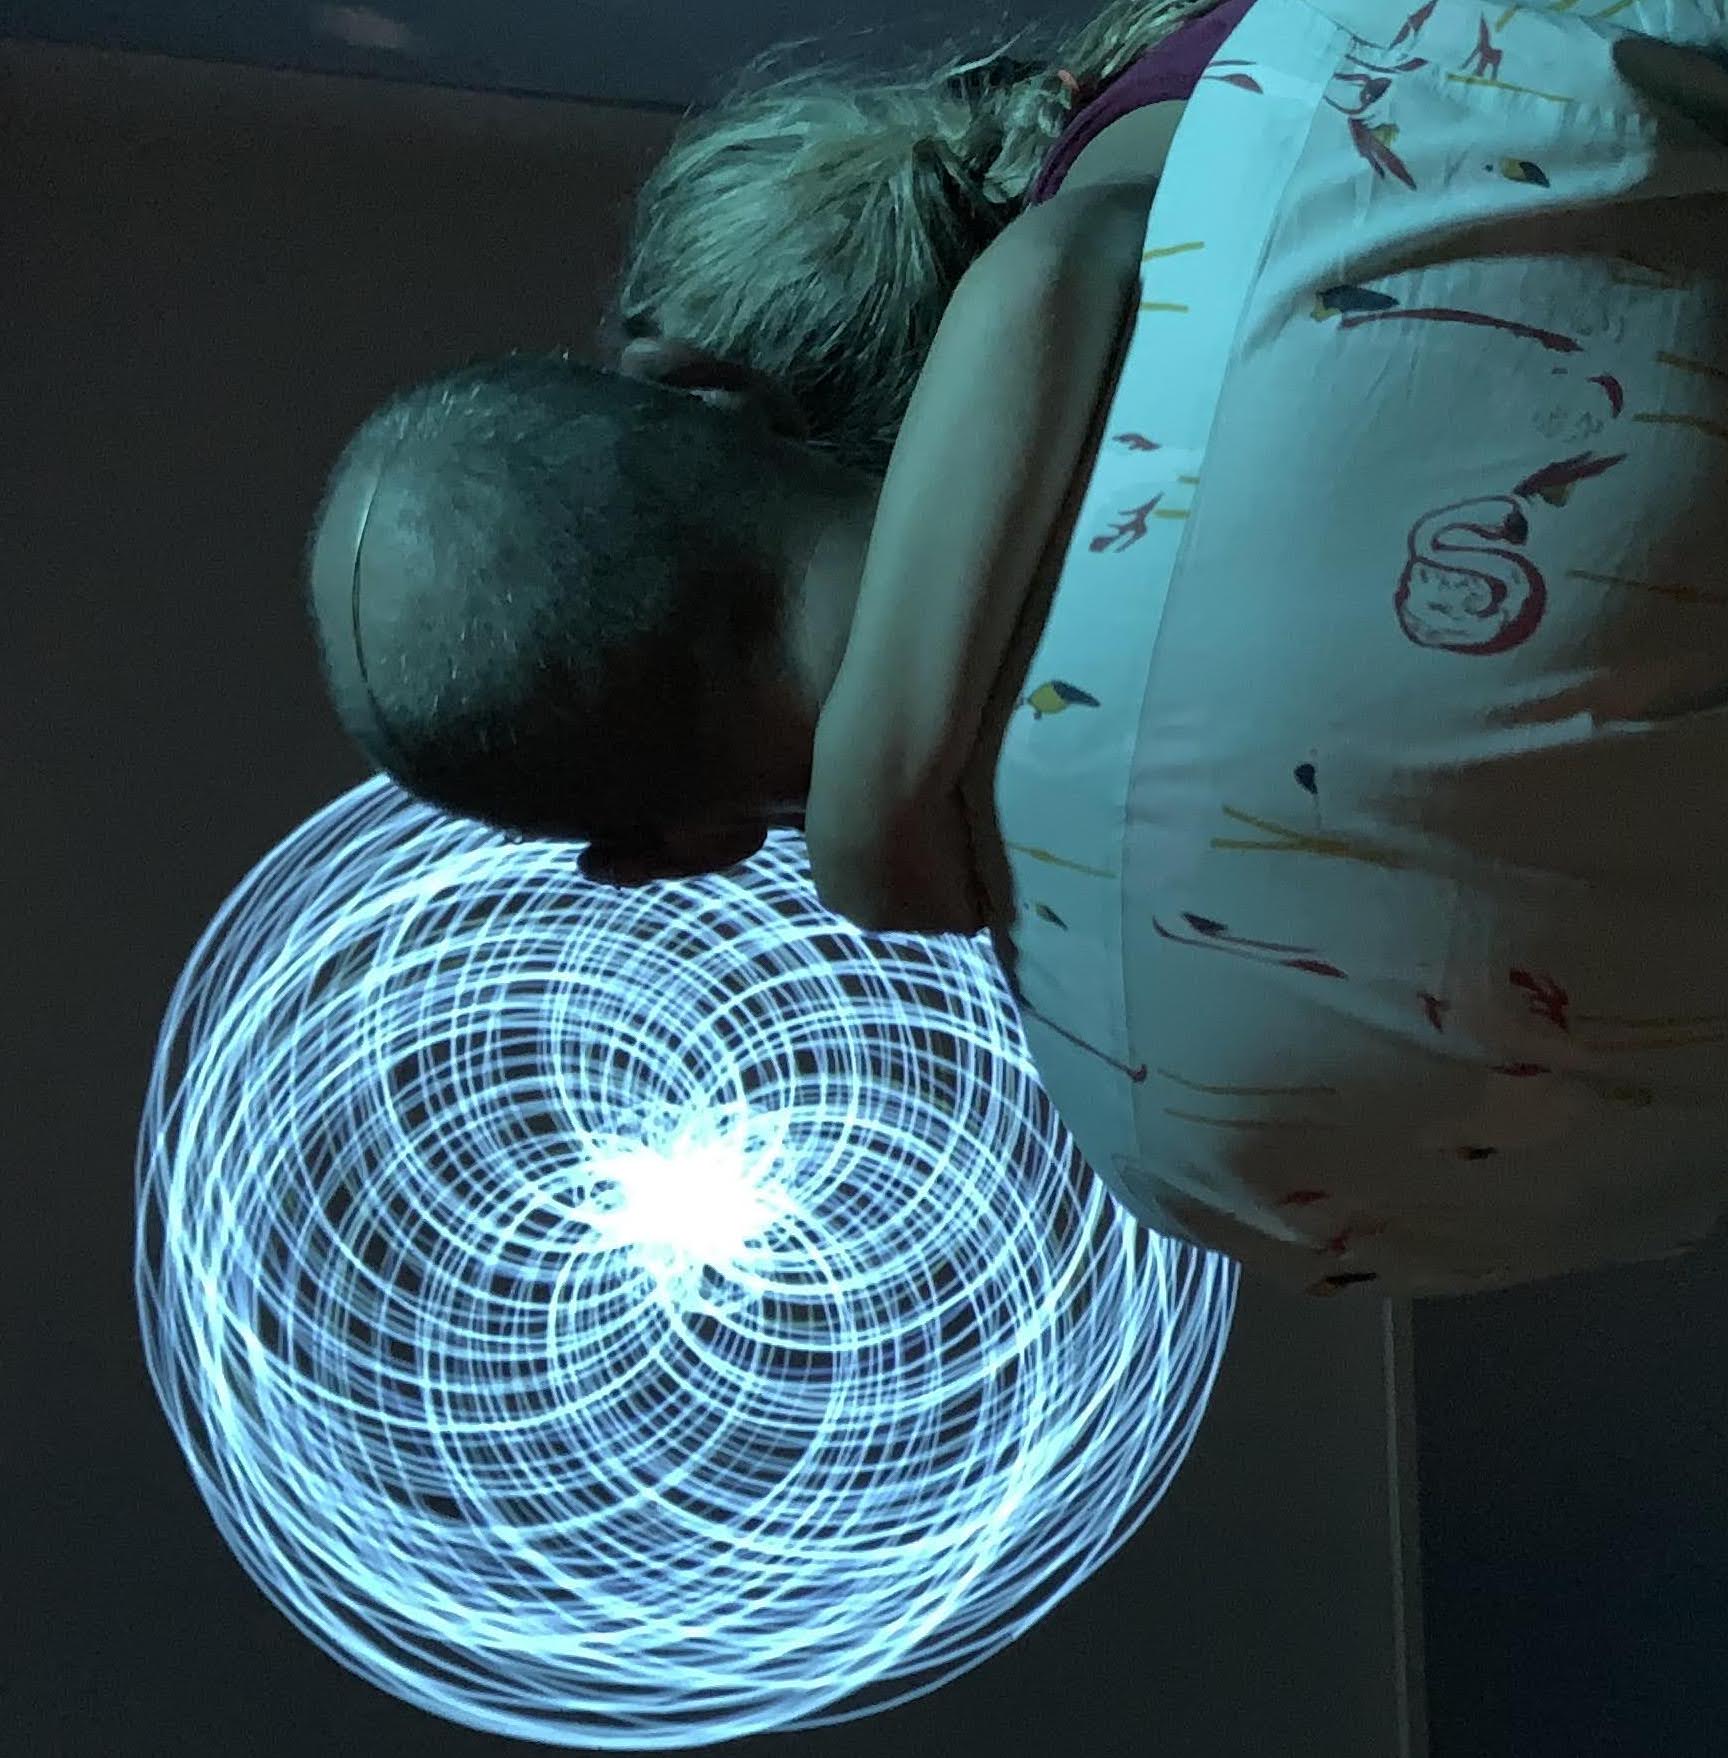
Oscilla
Oscilla is an audio-visual installation that combines scientific and artistic representation while encouraging experimentation and self-expression from the audience. Through a microphone, the audience can interact with a waveform presented in the style of signals shown on a typical oscilloscope. This interaction is enhanced by a ring-modulation filter, which provides a real-time audio feedback that encourages the audience to explore the boundaries of their own voices to produce visually and sonically complex results.
As the audience produces noise, pitch, or even harmonies, they will discover hidden patterns within the algorithm of the visual pattern, allowing them to gain control over the shape and movement of the waveform. The installation creates a space for self-discovery and introspection, as the audience experience the transformation of their own voice into a stunning visual representation.
Although an oscilloscope is typically associated with electrical engineering, it also serves as a medium for media artists to showcase the beauty inherent in signals. By interacting with Oscilla, the audience not only learns the principles of ring modulation in signal processing but also experiences the effect first hand. The work aims to evoke wonder in the audience as they discover a direct and tangible translation of meaning between the world of science and art.
// In collaboration with Rodney
Duplessis
// Currently Exhibiting at Museum of Sensory
and
Movement Experiences
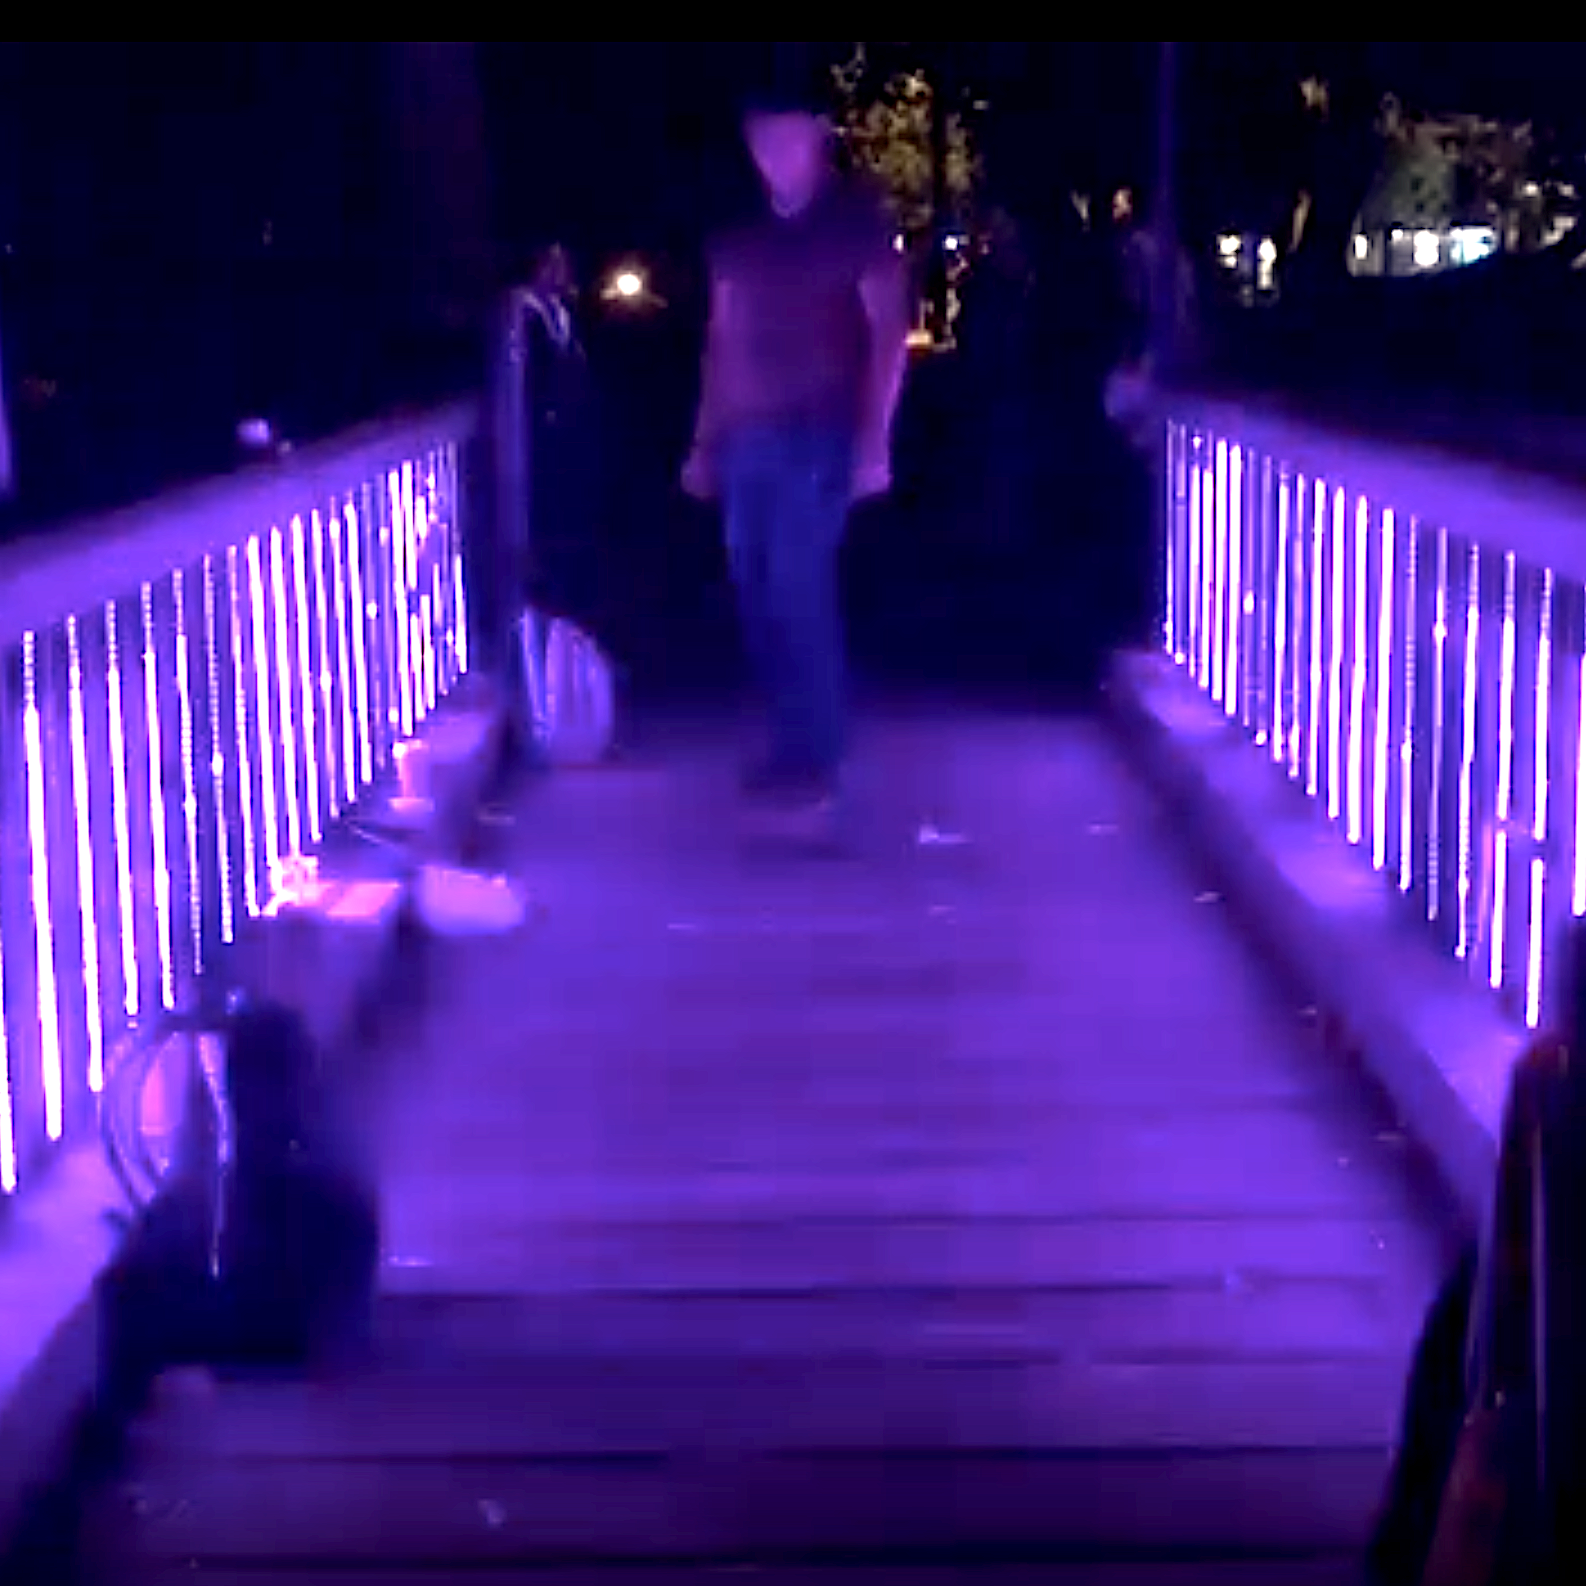
Luminaria
Luminaria is an immersive LED installation, part of the IV Lightworks exhibition, that transforms a bridge in Anisquoio Park into a dynamic canvas of light and movement. The installation features an array of LED lights that respond to the incoming traffic, including pedestrians, bikes, and skateboards, detected by transducers attached underneath the bridge.
The installation is powered by four Arduino units that make it programmable, allowing for a range of different patterns and color schemes to be displayed in response to the movements of the passersby. The effect is mesmerizing, as the bridge becomes a living, breathing entity, illuminated by the colorful patterns and shapes that shift and change in response to the motion of the people passing by.
Through the use of technology and light, Luminaria invites viewers to contemplate the relationship between movement and art, while offering a unique and immersive experience that engages the senses and the mind. Visitors to the exhibition are encouraged to participate in the installation by walking, cycling, or skateboarding across the bridge, becoming part of the artwork itself and contributing to the dynamic display of light and movement.
Luminaria is a testament to the power of art to transform public spaces, and to the potential of technology to create immersive and interactive experiences that captivate and inspire.
// In collaboration with: David Aleman, Hsin Hsuan Chen, Chris Hoang,
Intae Hwang,
Xindi
Kang, Lu Liu, Wen Liu, Brenda Morales, Andrew Piepenbrink, PJ Powers,
Rebecca
Prieto,
Annika Tan, Leonardo Vargas, Muhammad Hafiz Wan Rosli, Dan Wang, Carmen
Wen,
Junxiang
Yao
// Exhibited June 2016 - June 2017, Anisq'Oyo Park, Isla Vista, CA
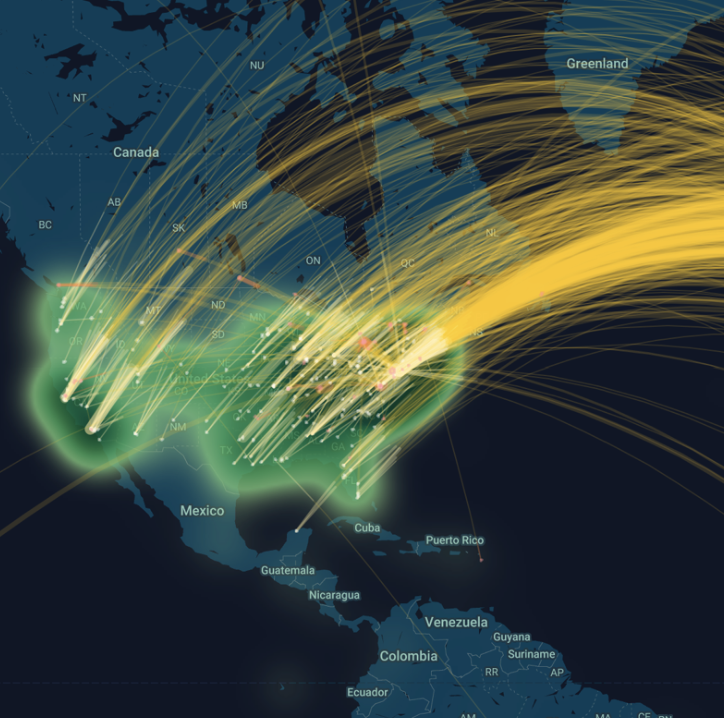
GeoD
GeoD is a data visualization tool that sheds light on the relationship between named entities in topic models and their geographic context. By leveraging the Google Maps JS API, GeoD allows users to explore the locations mentioned in a topic model, from a global scale down to the street level. The tool also provides a way to analyze the relationship between the locales and the publishers related to a selected topic, revealing patterns in publishing activities and helping digital humanities researchers identify regional biases.
What sets GeoD apart is its ability to take raw output from an LDA model and utilize the Illinois Wikifier ( L.Ratinov et al., 2011) to confirm the recognition of named entities and eliminate duplications. By mapping the geographical information and publishers associated with each named entity, GeoD enables the analysis of locations discussed in the corpus underlying the model, revealing complex patterns and connections that are not readily apparent from traditional text-based analysis.
GeoD is part of the Topic Model Observatory, a 4 humanities project funded by the Andrew W. Mellon Foundation that aims to help researchers study public discourse about the humanities at large data scales. By revealing previously unseen insights into the geographic distribution of topics, GeoD helps researchers uncover new connections and patterns, ultimately leading to a more comprehensive understanding of the data at hand. While the tool focuses primarily on journalistic articles available in digital textual form since 1981, its applications are far-reaching and can be utilized across a range of topics and contexts. Through our use of GeoD, we unlock a deeper understanding of the interconnectivity and complexity of the world we inhabit.
// Working Version of Geod with 250 Topic Models from WE1S Corpus
// Developed for the WE1S
Project
see Topic
Model Observatory Guide for instructions on using the full tool-kit.
// Publications:
https://doi.org/10.1016/j.biosystems.2020.104208
https://doi.org/10.31219/osf.io/896wb
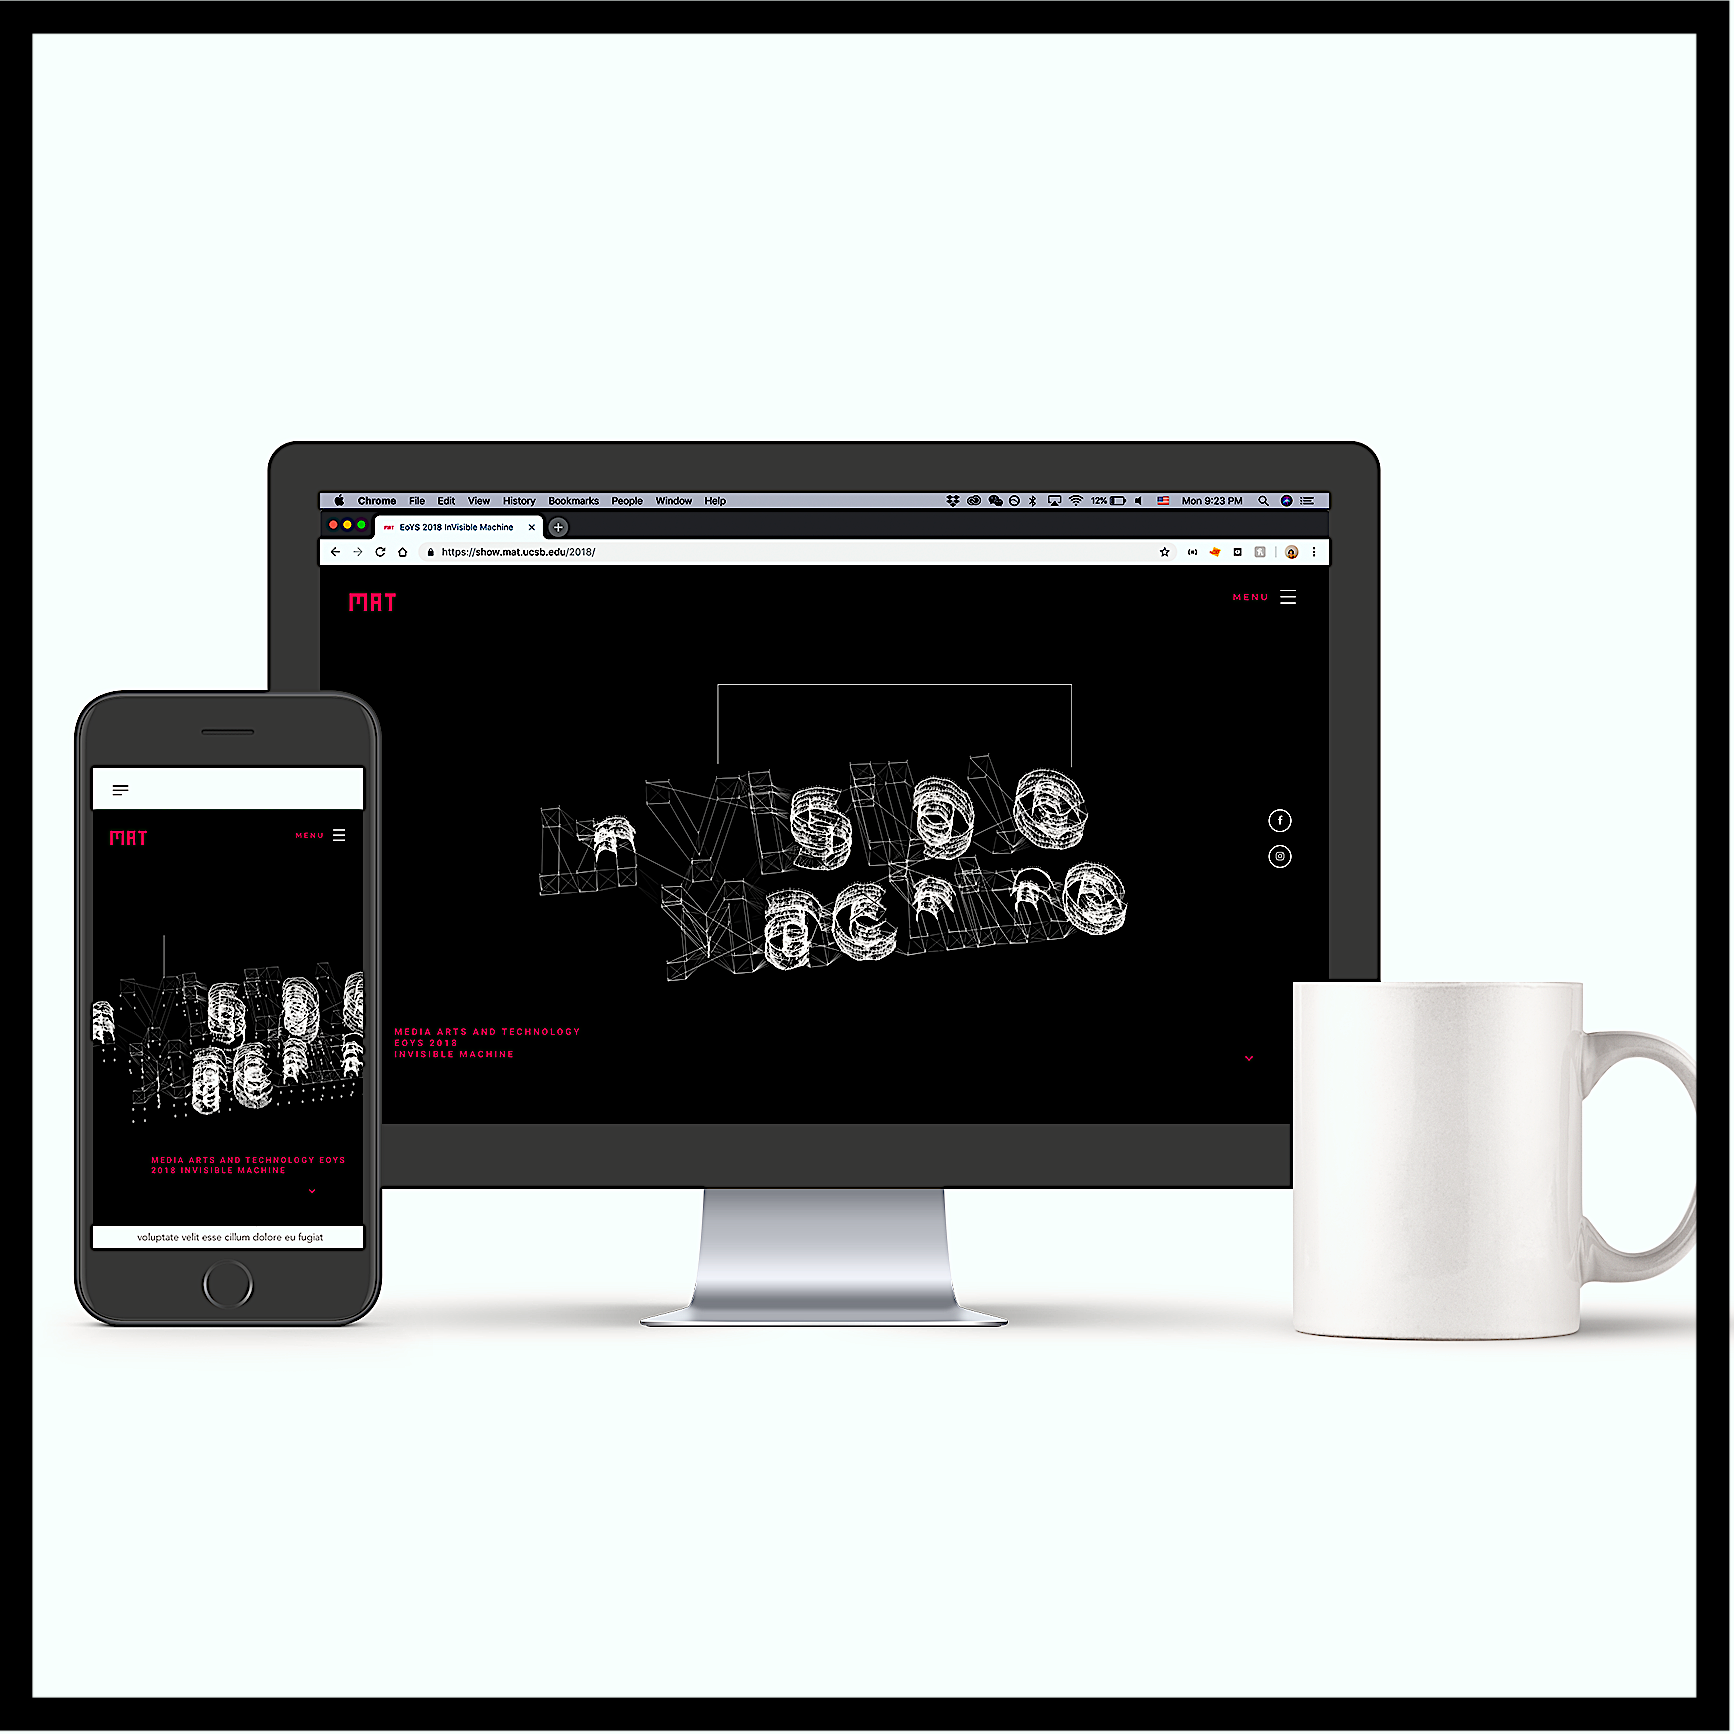
InVisible Machine --- MAT End of Year Show 2018
The Invisible Machine --- MAT End of Year Show 2018 is a curated exhibition featuring media art works and research demos from the Media Arts and Technology program. Each year we welcome hundreds of visitors from all around the world to celebrate a year of extraordinary work with us. Our theme this year is 'Invisible Machine', representing the mechanism of inducing transformation in the world of Media Arts. At MAT, our community research is the art of the “invisible becoming visible” in every field, from revealing the abstracted processes between input and output of a machine, to turning the complicated scientific data into shapes and colors. As technologists and artists, we weave through this diverse research in novel ways, creating new works that transcend the present way we view the world. Our show is the product of this process, and we invite all to join us in its celebration.
As the organizer of the show, I was thrilled to welcome visitors from all corners of the world to experience the extraordinary works of our talented artists and researchers and was immensely proud of the hard work and dedication that our artists and researchers put into their projects. I was also deeply moved by the way that visitors responded to the works on display. Whether they were experts in the field or simply curious members of the public, everyone who attended the show was captivated by the way art and technology change the way we see the world. The MAT End of Year Show was a testament to the immense potential for media artists to push the boundaries of human perception and creativity.
// Show Website: show.mat.ucsb.edu/2018
// Show Highlights:www.mat.ucsb.edu/eoys2018/